

IMAGE
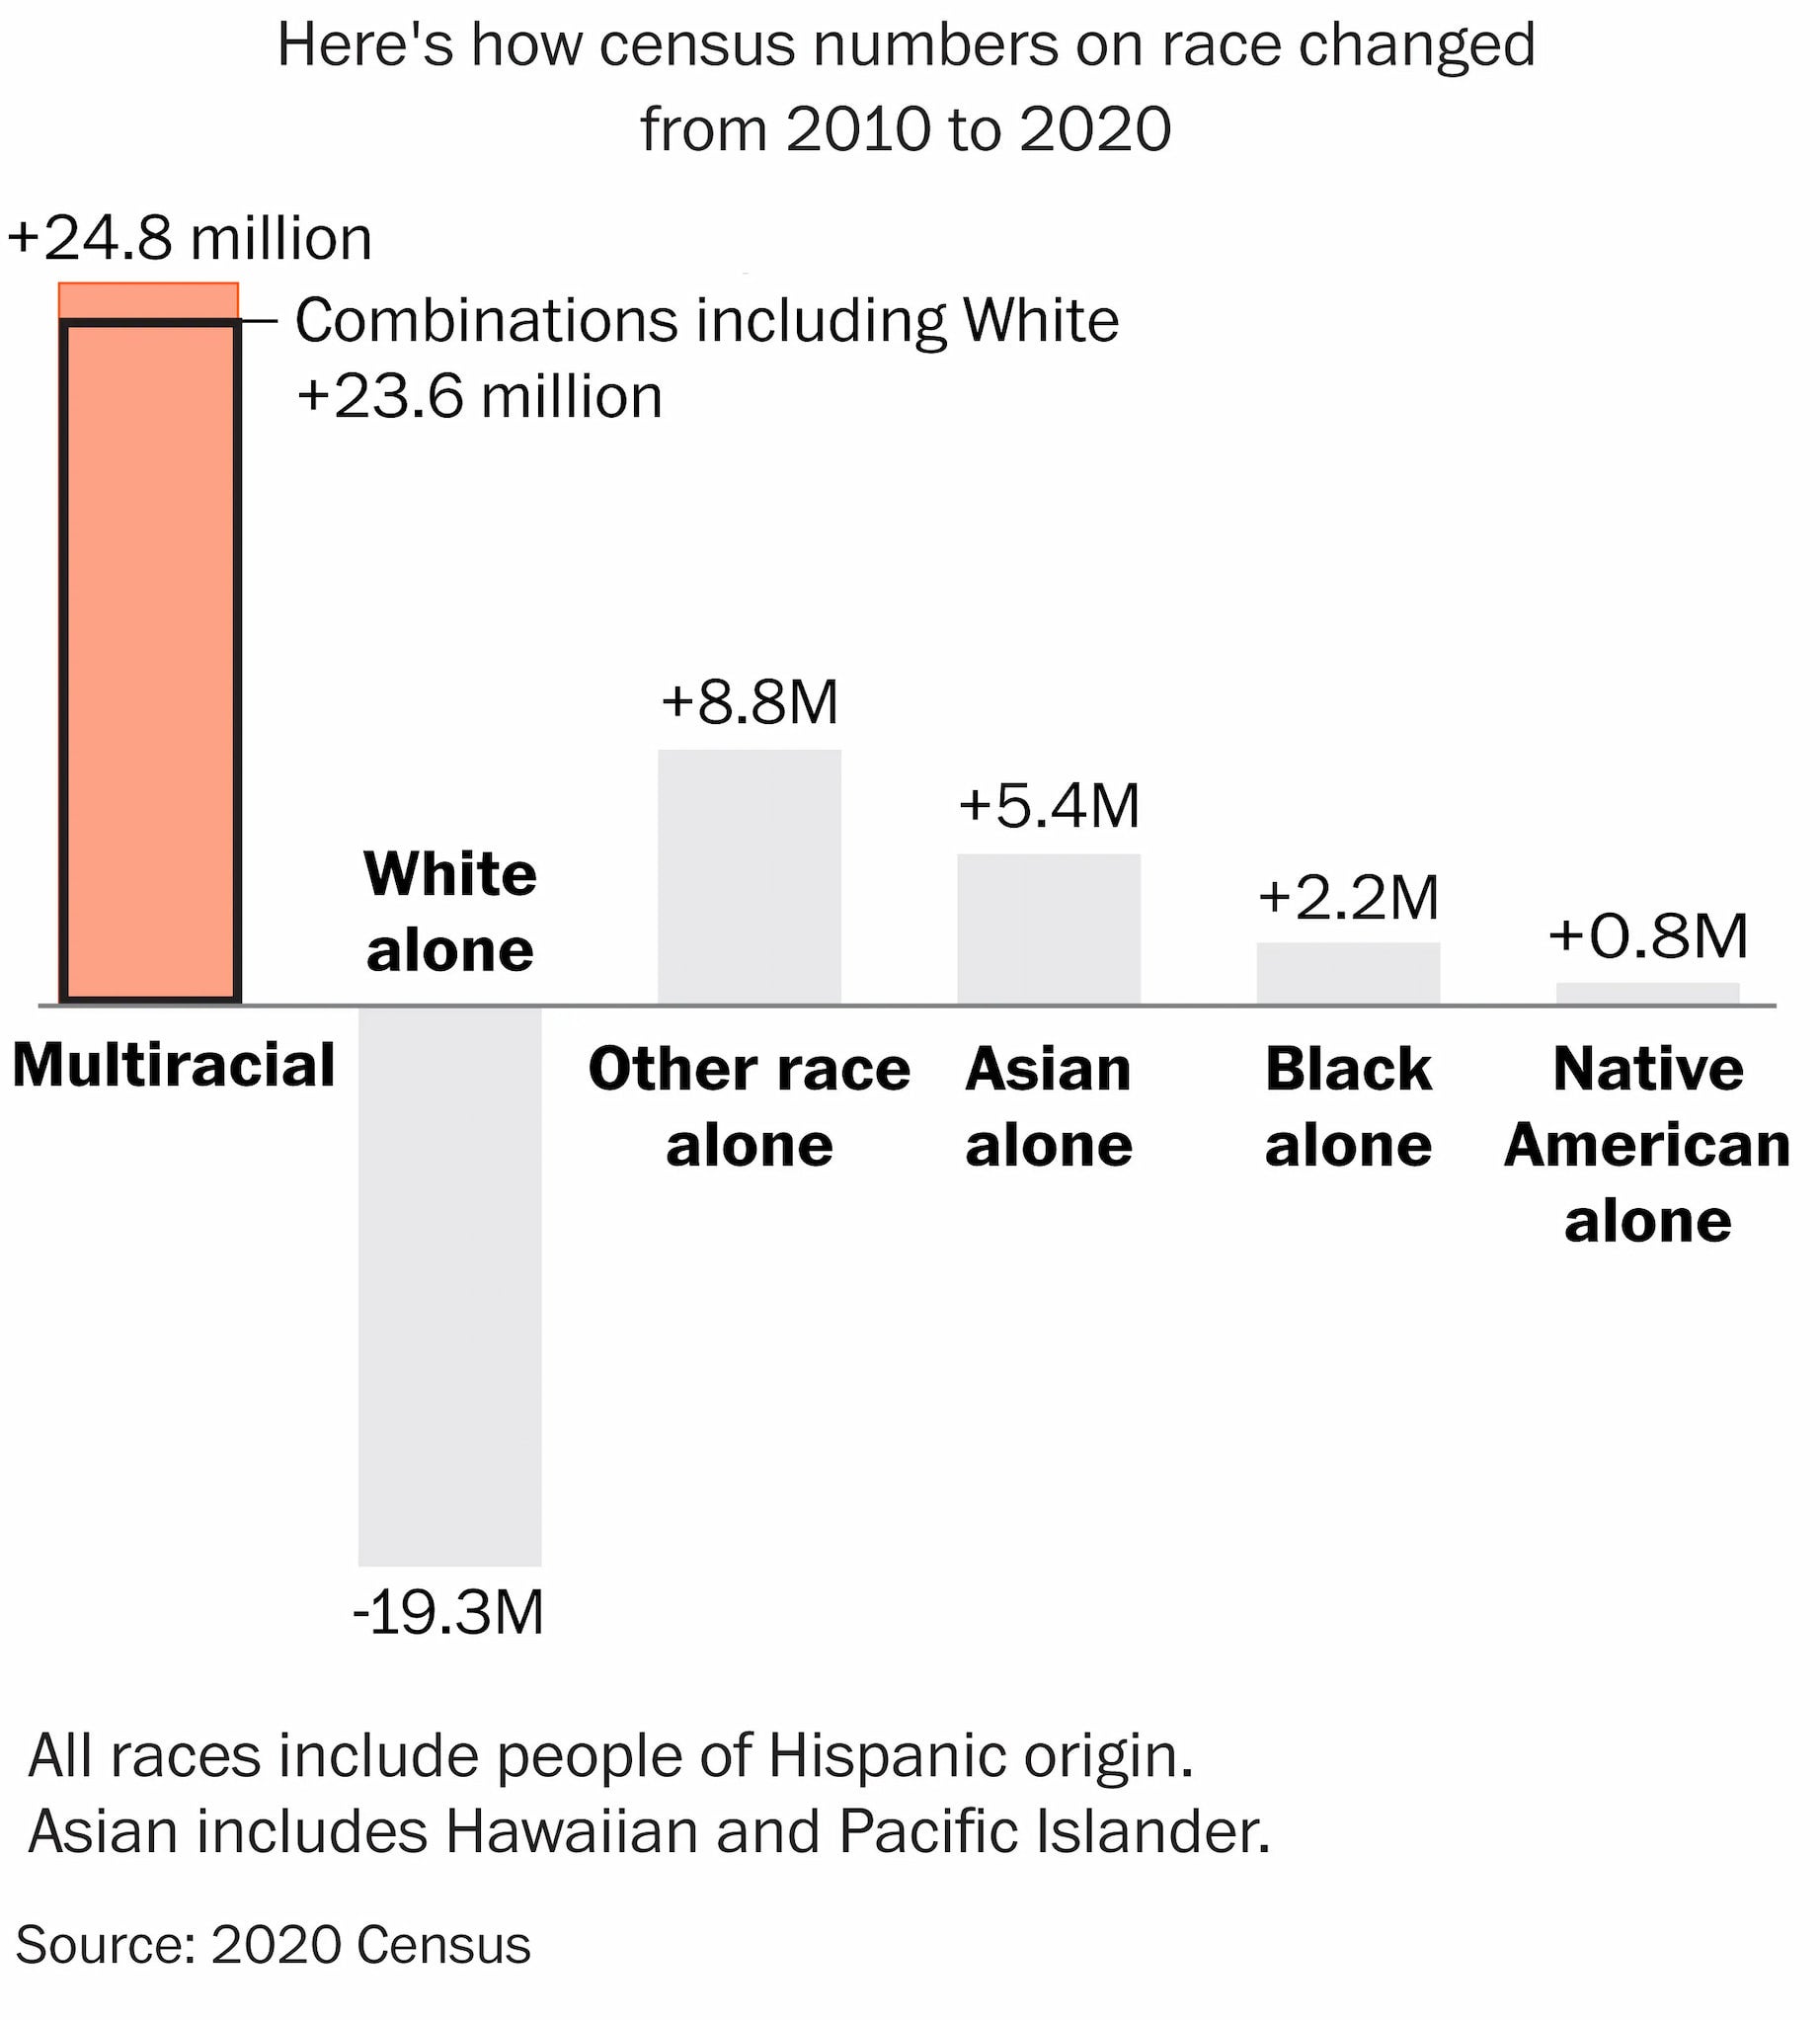
Illustration of People Indentifying as Multiracial 2010-2020
Object ID
34.03.01
Citation (Chicago-style 18th Edition)
The Washington Post
.
Illustration of People Indentifying as Multiracial 2010-2020
.
2021
.
https://www.washingtonpost.com/nation/2021/10/08/mixed-race-americans-increase-census/?utm_campaign=wp_graphics&utm_medium=social&utm_source=twitter
.
Multimedia details
Creator
The Washington Post
Publisher
The Washington Post
Date
2021
Type
Image
Format
Diagram
File Format
jpg
Source
Data Source: US Census Bureau, 2020
Licensor
The Washington Post
MUMI Number
34.03.IMG.016
Creator
The Washington Post
Publisher
The Washington Post
Date
2021
Type
Image
Format
Diagram
File Format
jpg
Source
Data Source: US Census Bureau, 2020
Licensor
The Washington Post
MUMI Number
34.03.IMG.016
Used in reliance on Fair Use
This in-copyright item is presented here in accordance with the authors’ fair use rights. Its use in other contexts may require permission from the copyright holder.