


Module 3: Interracial Marriage Patterns and Multiracial Demographics
Does learning about the experiences of multiracial Pacific Islanders and Asian Americans reveal ways to combat racism?
What accounts for the rise in interracial marriages and the number of multiracial people? Why do so many Pacific Islanders and Asian Americans who identify as multiracial have a white parent? An important part of the answer to these questions was the national legalization of interracial marriage in the 1967 Supreme Court case Loving v. Virginia, which ushered in a large rise in the birth of multiracial people—a phenomenon some refer to as the biracial baby boom. In addition, US sailors and, later, soldiers across the Pacific and Asia during World War II brought Asian and Pacific Islander communities into contact with US laws regarding marriage, citizenship, and race.
In this module, we examine contemporary patterns of interracial marriages shaped by the history of laws, wars and migration. We also explore the census data on who multiracial people in the United States are and where they live.
What are the patterns of interracial unions in the United States, and how have these shaped the numbers of multiracial Americans?
What are the most common combinations of ancestry for multiracial Pacific Islanders and Asian Americans?
Why do so many mixed people have a white parent?
Multiracials in the 2020 Census
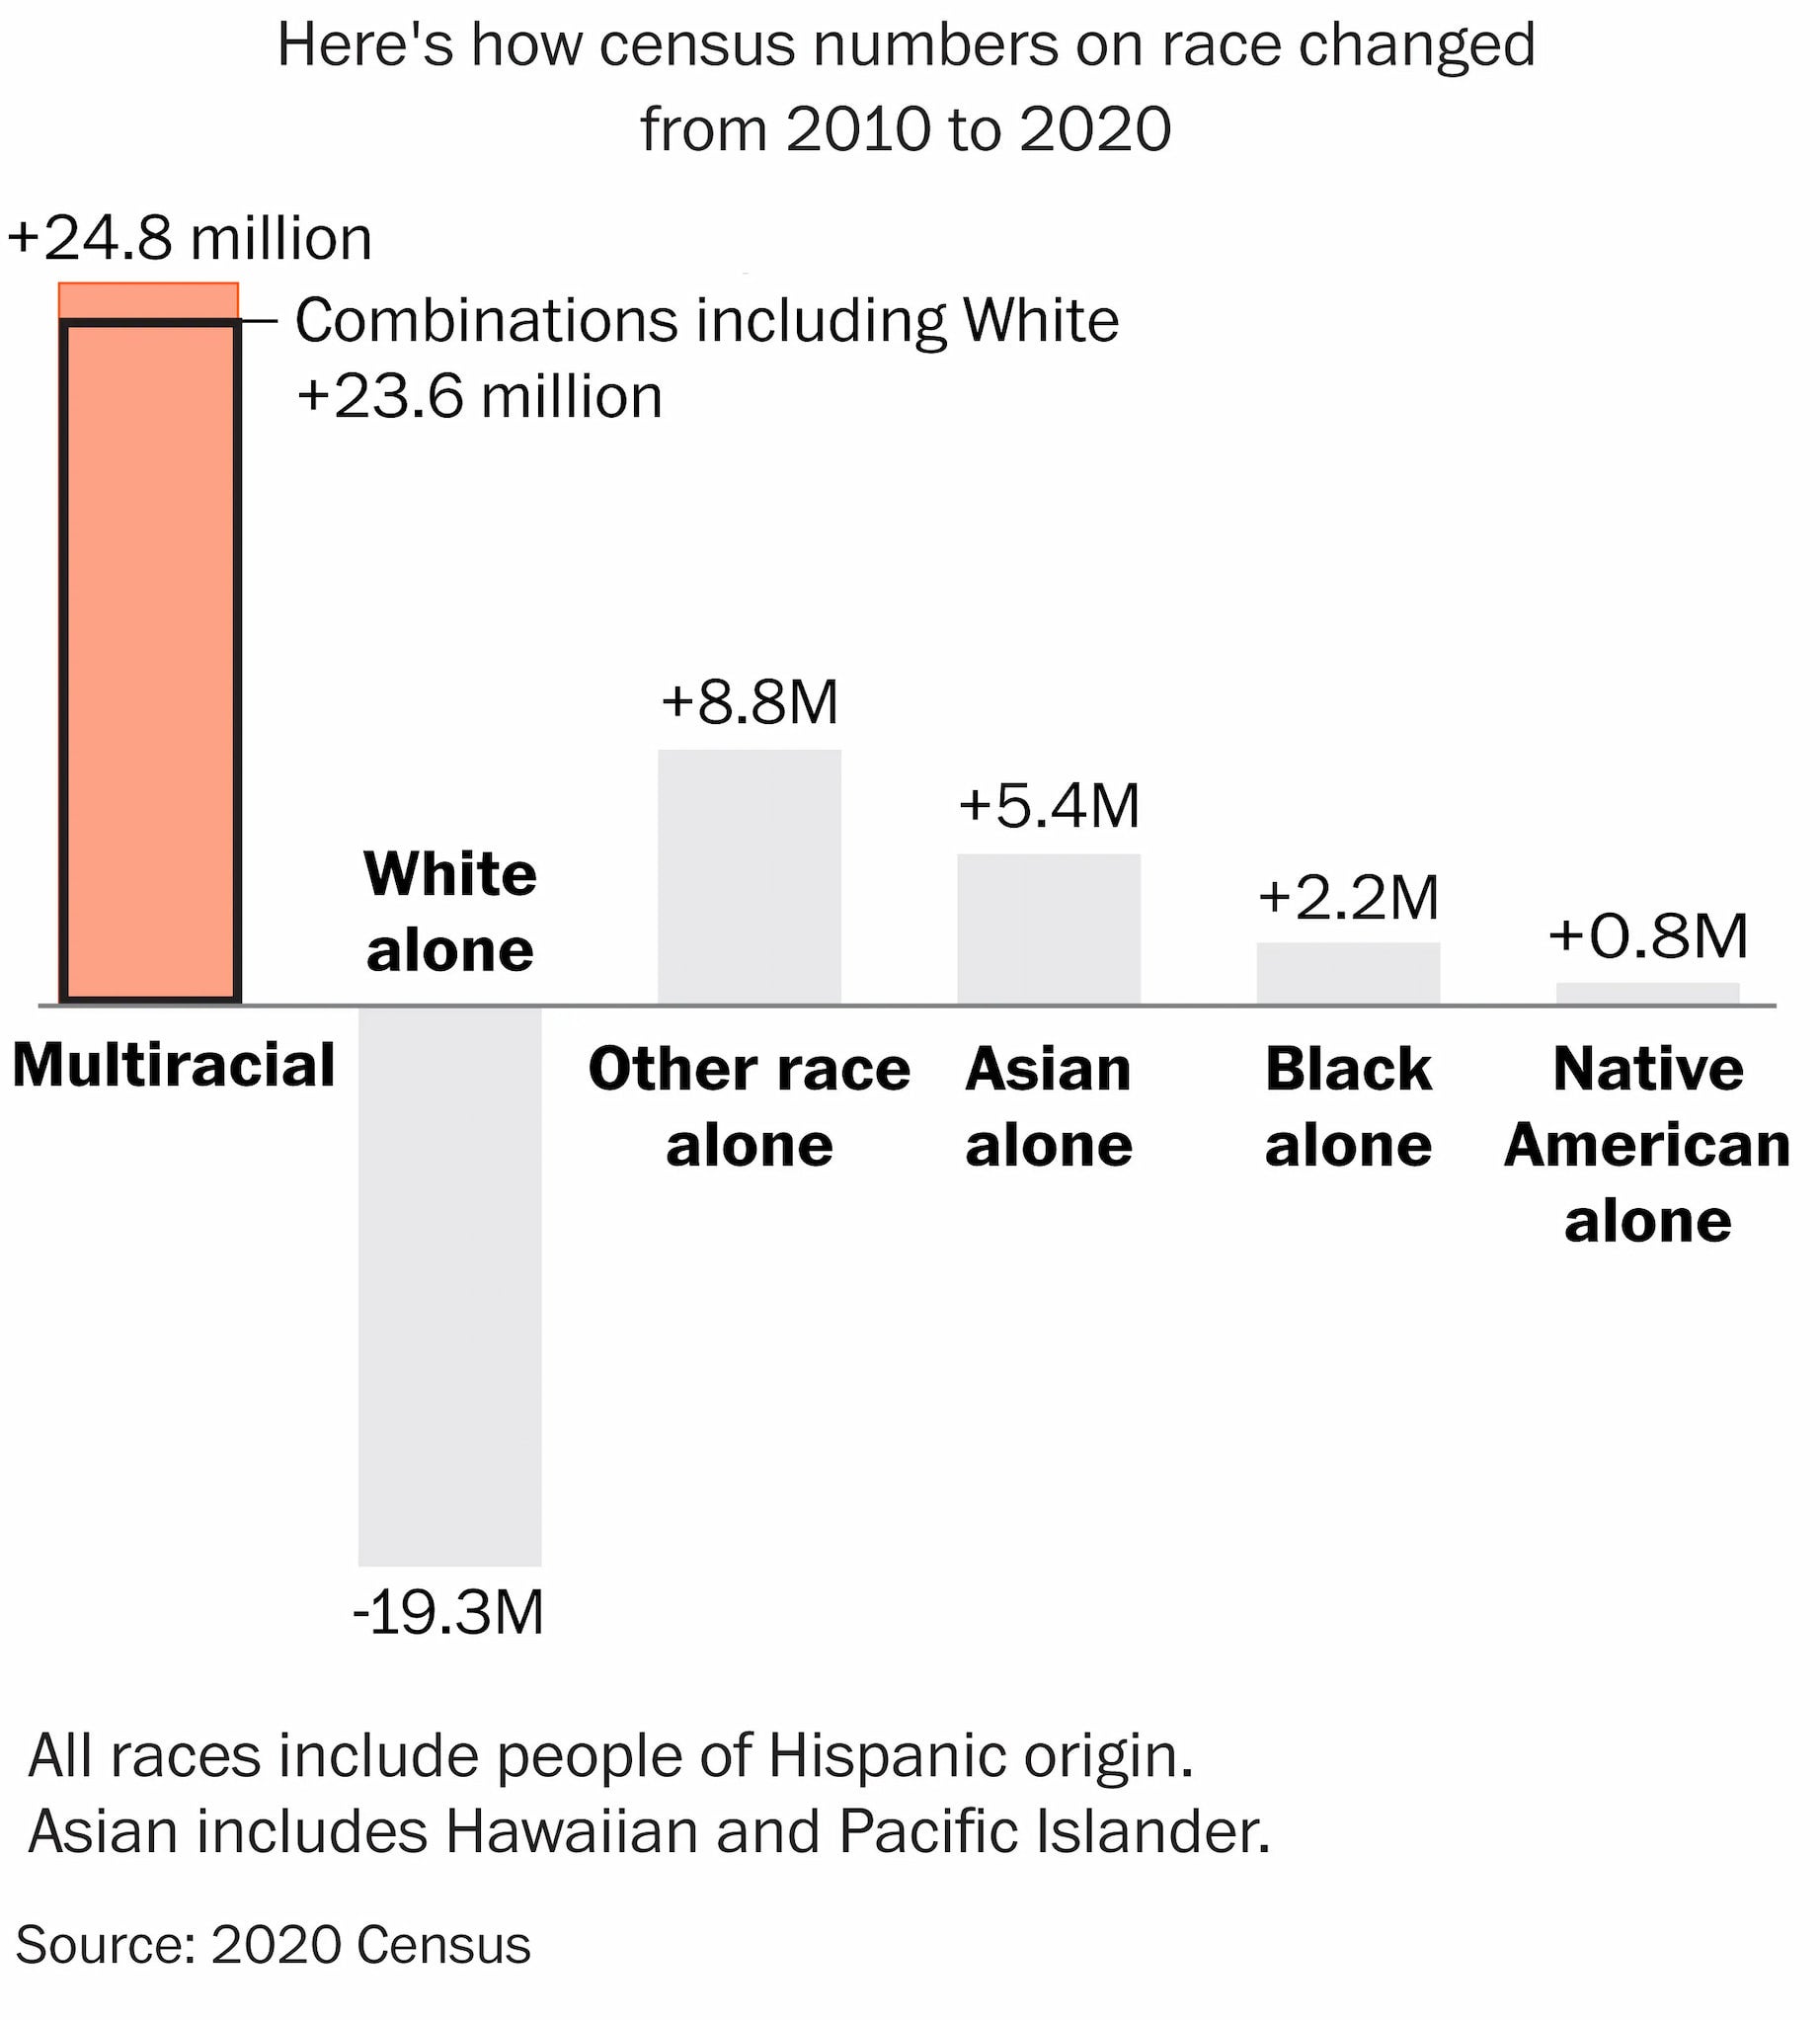
Image 34.03.01 — This figure illustrates the increasing number of people who identify as “Multiracial” compared to other racial categories between 2010 and 2020. (Source: US Census Bureau, 2020)
In 2000, only 2.4 percent of the US population selected more than one racial category on the US census. This increased to 3 percent ten years later, and jumped to 10 percent in 2020. While the census is not a direct reflection of “reality,” it charts the remarkable growth of the multiracial population.
For instance, people who may have selected just “Black or African” in 2010 may have later selected “Black or African” and another racial category in 2020. Although the census outlines the racial categories people must select from, individuals who fill out the census form can choose their identities in different ways depending on the questions asked.
In the 2020 Census, people who selected more than one racial category increased by 127 percent over the previous decade, accounting for more than 10 percent of the US population. The most common backgrounds were “White and Some Other Race,” followed by “White and Native American,” “White and African American or Black,” and “White and Asian.” While multiracial Asians are a small part of the US population–because Asians are a relatively small group at 7 percent (the largest ethnic group was Chinese)–intermarriage rates for Asian Americans are notably high. The same census showed that 39 percent of married Asians had a non-Asian spouse. In 2020, the largest Pacific Islander population in the United States was Native Hawaiian, followed by Samoan and CHamoru, though Pacific Islanders made up less than one percent of the US population.
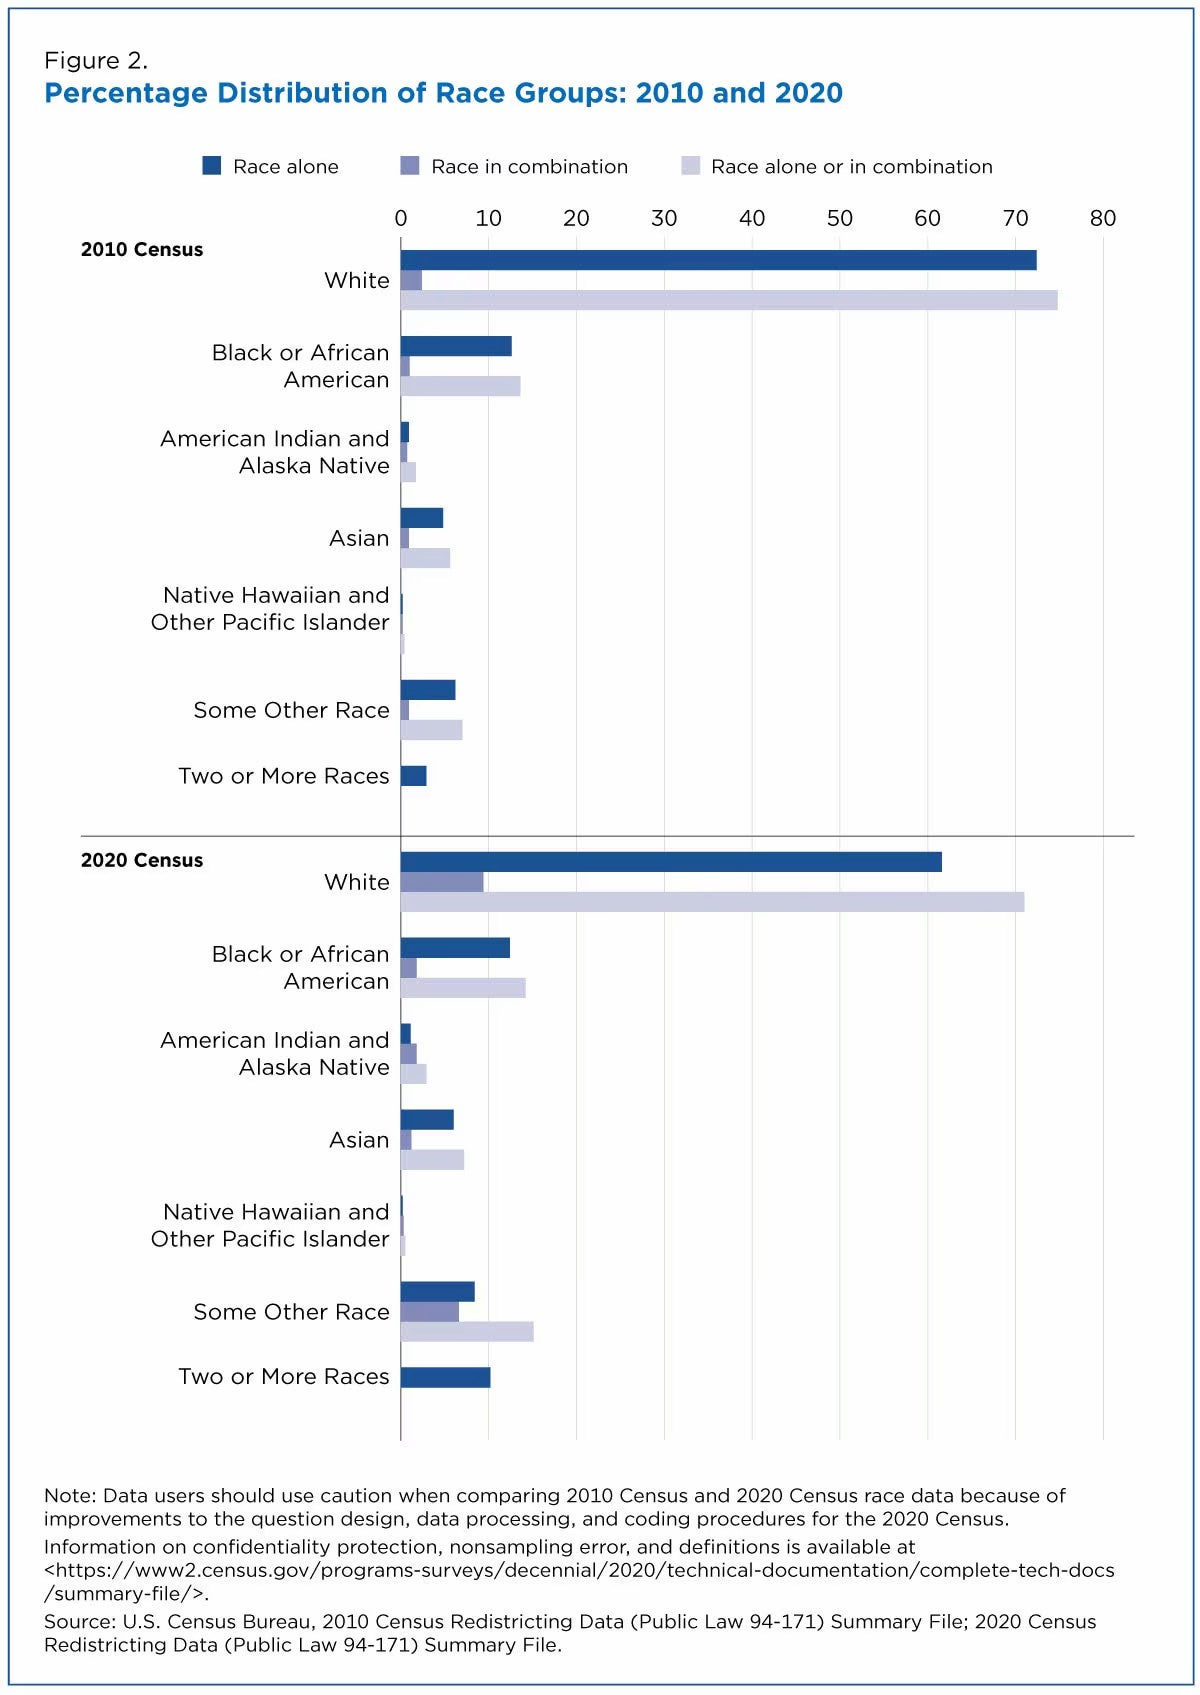
Image 34.03.02 — This figure depicts population data based on race collected in the 2020 US Census. In 2020, people who selected more than one racial category increased by 127 percent since the 2010 Census. (Source: US Census Bureau, 2020)
The Supreme Court case, Loving v. Virginia, which reversed the ban on interracial marriage, reflected Americans’ increasing openness to intermarriage, which led to a growing multiracial population. Other factors also account for these changing demographics. Immigration and this country’s engagement with nations across Asia and the Pacific—often through war and colonialism—is another part of this story.
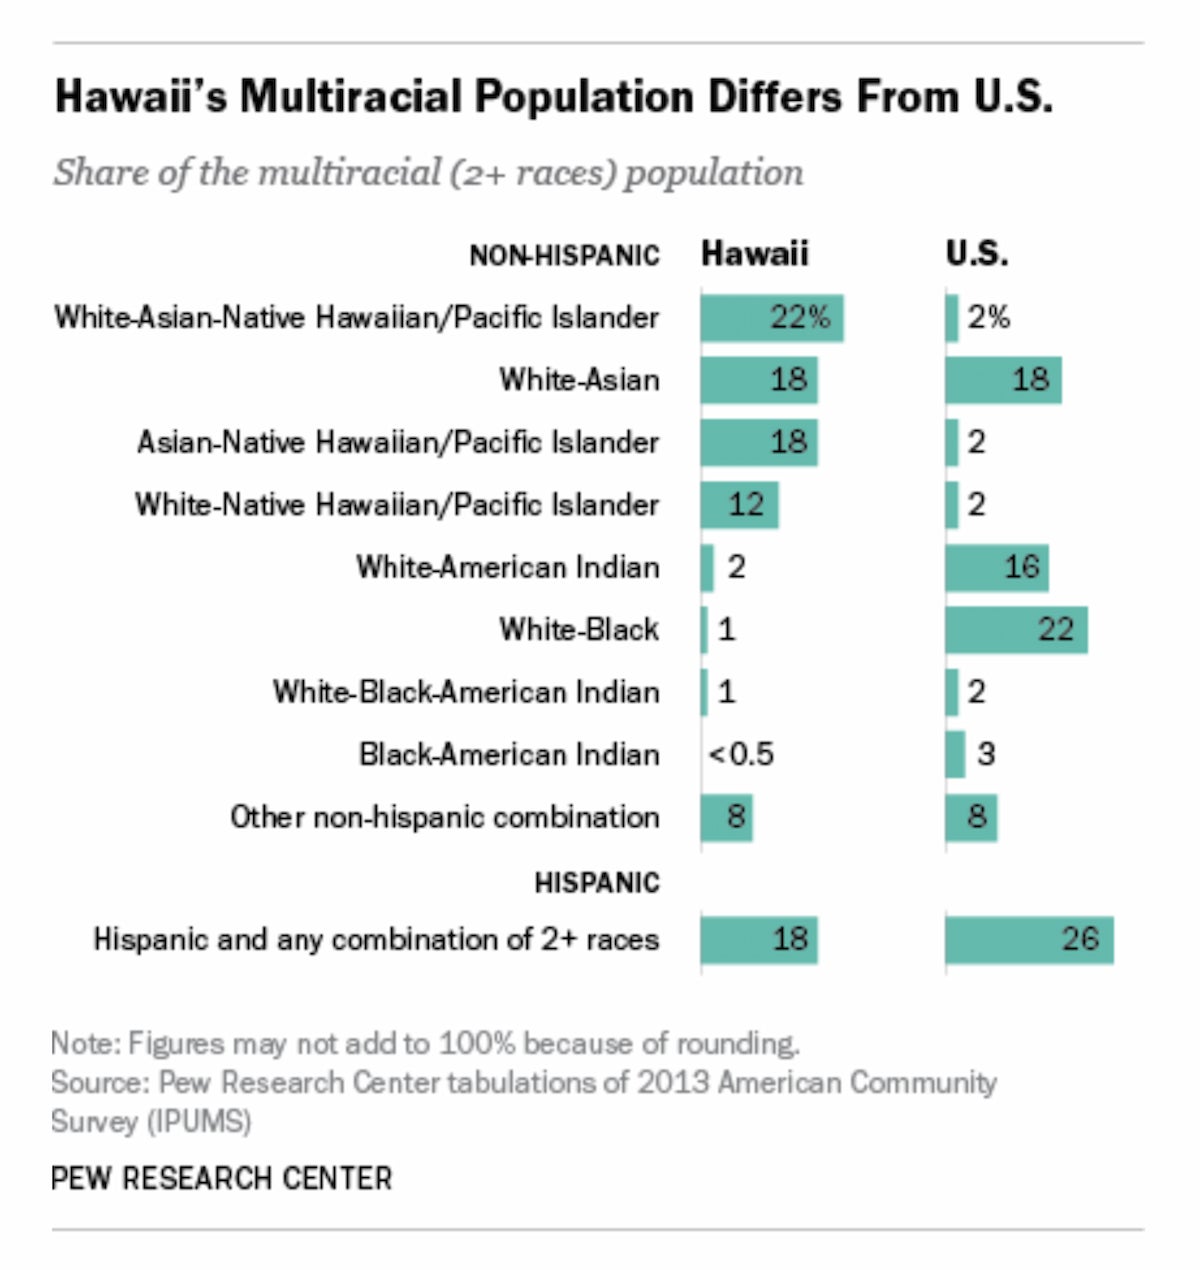
Image 34.03.03 — Hawaiʻi is home to the United States’ largest state population of multiracial Americans, with 22 percent identifying as multiracial Pacific Islander. (Source: Pew Research Center)
Immigration and Marriage Patterns in the Early Twentieth Century
Marriage and immigration patterns shaped one another in the Pacific and throughout Asian American history, and both were shaped by US law. For instance, the 1875 Page Act, one of the first laws regulating the migration of Asians to the United States, restricted the arrival of Chinese women. The resulting gender imbalance and increasing anti-miscegenation laws shaped marriage patterns among Chinese in the US. Nonetheless, many immigrants found creative ways to develop thriving communities.
Since the early 1900s, San Diego, California, has been home to generations of Mexipinos, a community initially established by Mexican women and their Filipino spouses. The food here reflects this cultural formation. The children of these unions have combined Filipino and Mexican culinary practices and opened restaurants such as Mexipino Craft in Chula Vista, California, which offers a “Mexipino Breakfast Sandwich” with SPAM, chorizo, and chicken tocino on Mexican conchita bread.
Farther north and around the same time, in the California Central Valley, Mexican women met Punjabi Indian men of the Sikh religion and formed families over generations. These couples sometimes did not speak the same language, yet they fused cultural, religious, and culinary expressions. Punjabi Mexican children recall growing up eating daal and beans, and the “roti quesadilla” is sold today at El Ranchero restaurant in Yuba City, California.

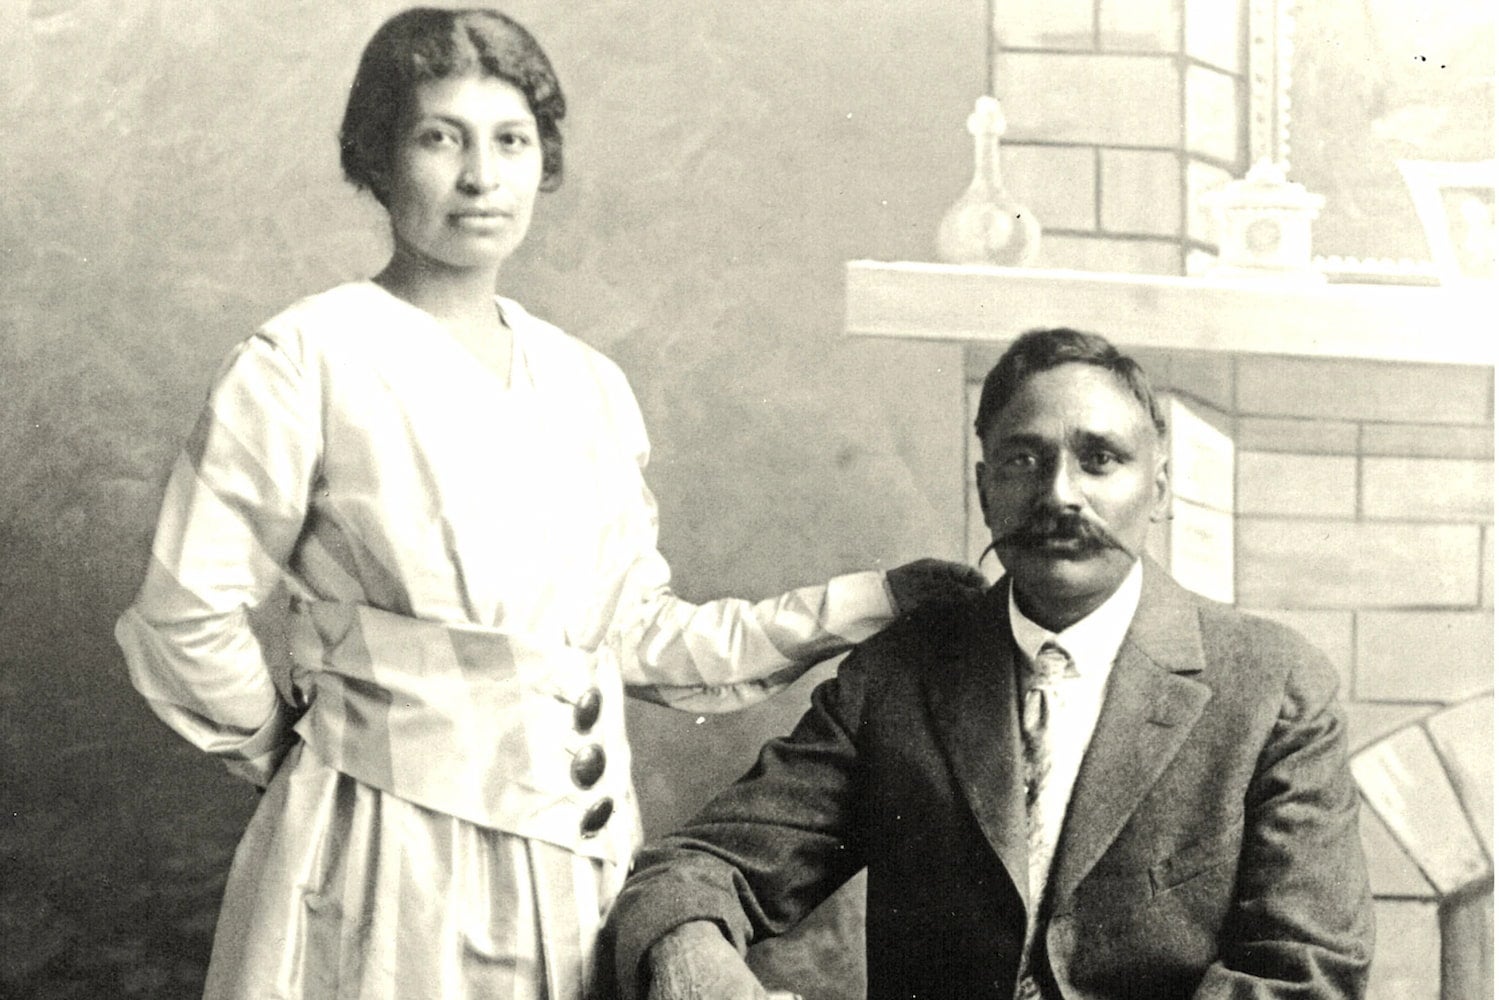
Image 34.03.04 — Rullia Singh (right) and Valentina Alvarez (left), a Punjabi Mexican American couple in Yuba Valley, California, pose for their wedding photo in 1917.
Post-World War II Interracial Marriages
While Mexipinos, Punjabi Mexicans, and other multiracial immigrant communities were forming within the United States, during World War II, millions of American soldiers of various racial backgrounds were sent to Asia and the Pacific. Some soldiers stationed in places like Kiribati, Okinawa, Japan, and Hawaiʻi had children with local women. The War Brides Act of 1945 later allowed the wives of American GIs, including Japanese women, to enter the United States, where they raised their biracial children. Yet across Asia, thousands of unclaimed children of American GIs and local women, called “Amerasians,” faced discrimination as they served as constant reminders of war, whether in Japan, Korea, Vietnam, or more recently in Afghanistan and Iraq.
These multiracial children, as well as the immigration of uprooted “war babies” to America, challenge notions of “colorblind” love and social progress following the 1967 Loving v. Virginia case. At the end of America’s war in Vietnam, Operation Babylift transported over three thousand Vietnamese orphans from South Vietnam, including the children of American soldiers and Vietnamese mothers, to the US. Tragically, the first flight ended in a fatal crash, killing over one hundred passengers.
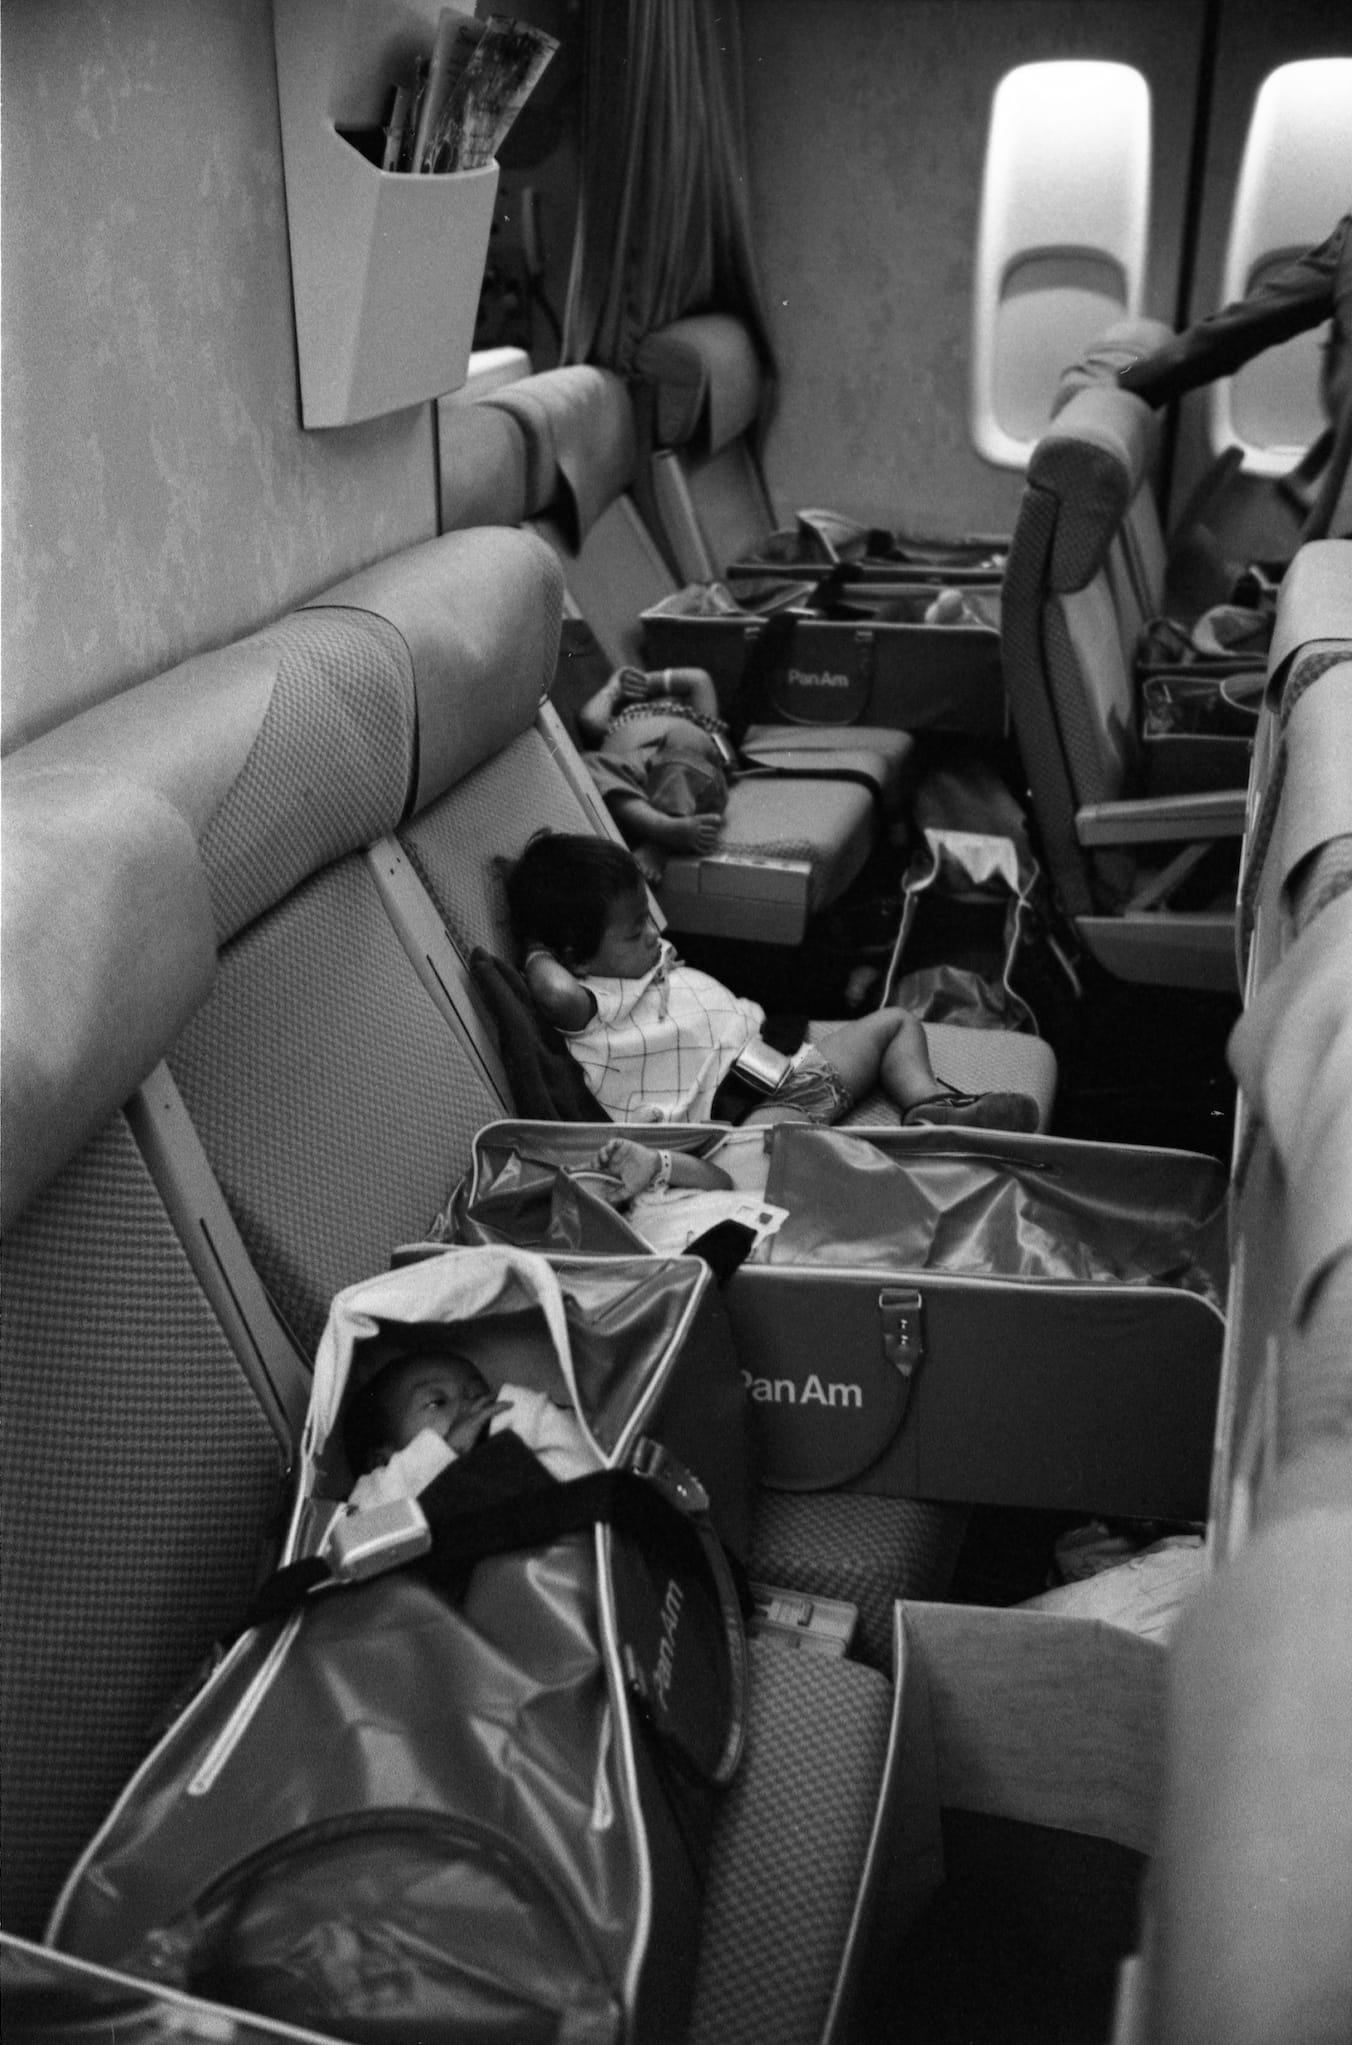
Image 34.03.05 — Vietnamese refugee children on an Operation Babylift flight to San Francisco on April 5, 1975. Over three thousand Vietnamese orphans were eventually transported to the US, including the multiracial children of American soldiers and Vietnamese mothers.
The Asian mother-white father and Asian mother-Black father backgrounds of these children parallel the patterns of intermarriage within the United States and suggest something other than “colorblind love.” Less studied are the thousands of children of US soldiers across the Pacific raised by their Islander mothers who could not marry US soldiers due to anti-miscegenation laws. Those who were permitted to marry were often prevented from moving to the US due to immigration laws that restricted their entry.
Patterns of Interracial Unions
The Immigration and Nationality Act of 1965 foundationally reshaped America, expanding the footprint of Asian Americans and Pacific Islanders across the United States. They occupied various class statuses, from wealthy professionals in medicine and engineering to working-class ethnic groups struggling to access health care and adequate housing. The children of these immigrants include those who share an identity as “Asian Americans” or “Pacific Islanders” who are now represented in every segment of American society.
Many people find their spouses at work or at school, and many Asian Americans have married coworkers and fellow classmates across racial backgrounds—especially, as the data shows, partners who are white. On the other hand, working-class Asian Americans living in ethnic enclaves, including working-class neighborhoods and predominantly Asian suburbs, have lower outmarriage rates. Across class and educational backgrounds, however, the increasing population and diversification of Asians in America have led to growing rates of interracial marriage and an explosion of multiracial Asian American youth.
Although this chapter draws on the US census for a snapshot of multiracial Pacific Islander and Asian American communities, a major limitation of this method is that the census only began collecting information about same-sex couples in 1990. It does not provide detailed information about LGBTQ+ people. The census information we do have reveals that same-sex couples are more often in interracial relationships than opposite-sex couples. In 2020, 31 percent of same-sex couples were interracial, up from 19 percent in 2013. For opposite-sex couples, these figures are lower, at 19 percent in 2020 and 9 percent in 2013.
Most of the data we have about interracial marriage and multiracial people focuses on heterosexual households. In 1980, 23 percent of Asian marriages in the US were interracial, with about half of intermarried Asian men marrying white women and three-quarters of intermarried Asian women marrying white men.
In 1990, 10 percent of Asian men married white women, and 20 percent of Asian women married white men. Those numbers rose to 20 percent and 40 percent, respectively. By 2020, why did 11 percent of intermarried couples consist of a white man and an Asian woman, whereas just 4 percent of couples included a white woman and an Asian man? Among Asians and Latinos, interethnic marriages—or marriages across Asian groups (like Vietnamese and Korean) or across Latino groups (like Mexican and Salvadoran)—are also on the rise. But if we highlight Black marriage patterns, we get a slightly different view.
In 2000, Indian men represented the Asian group most likely to marry Black spouses, at 0.6 percent, while Korean men were close to zero percent. Analysis of the data reveals that non-Black groups, including Asians, rank Black people as their last marital choice. Simultaneously, the formerly segregated South witnessed the largest increases in interracial marriages over the past ten years, the majority between Black and white spouses. About 22 percent of Black men outmarried, compared with 9 percent of Black women, in 2008, when “White-Hispanic” outmarriages counted for 41 percent of all interracial marriages.
Stated another way, in 2008, 1 percent of white people married Black spouses, and 1 percent of whites married Asian partners, revealing the enormous tendency toward endogamy, or the practice of marrying within your own racial group. In fact, as recently as 2009, a Louisiana judge refused to marry interracial couples out of concern for the children of these unions, sparking national outrage.
Despite the focus on a growing multiracial America, we should remember that the United States is still a predominantly monoracial and endogamous nation: white people are least likely to outmarry, and most Americans have a spouse who shares their background.
Native Hawaiians
There are several significant communities of multiracial Pacific Islanders and Asian Americans, including multiracial Hawaiians, or hapas. Nearly one-quarter of the population in the Hawaiian Islands identified with more than one race on the 2020 Census, making it the US state with the highest proportion of mixed people. Relatedly, Hawaiʻi is the state with the highest proportion of interracial marriages. Island demographics include large Asian and Pacific Islander communities, including Chinese, Japanese, Hawaiians, Samoans, and Filipinos. Native Hawaiians, also known as Kānaka Maoli, are Indigenous to the islands and, like African Americans, often have European or other ancestries.
Native Hawaiians have experienced centuries of racial mixing in part due to Hawaiʻi’s geographic location as a meeting ground in the Pacific. Other Pacific Islanders arrived in Hawaiʻi well before white (American and European) and Black sailors, missionaries, business people, military personnel, and tourists from around the world. Many Hawaiians engaged in relations with these foreign (haole) arrivals, from sailors on European and American ships to US military personnel and tourists. Hapa is a term for Indigenous Hawaiians with mixed ancestry, including the children born of these and other unions.
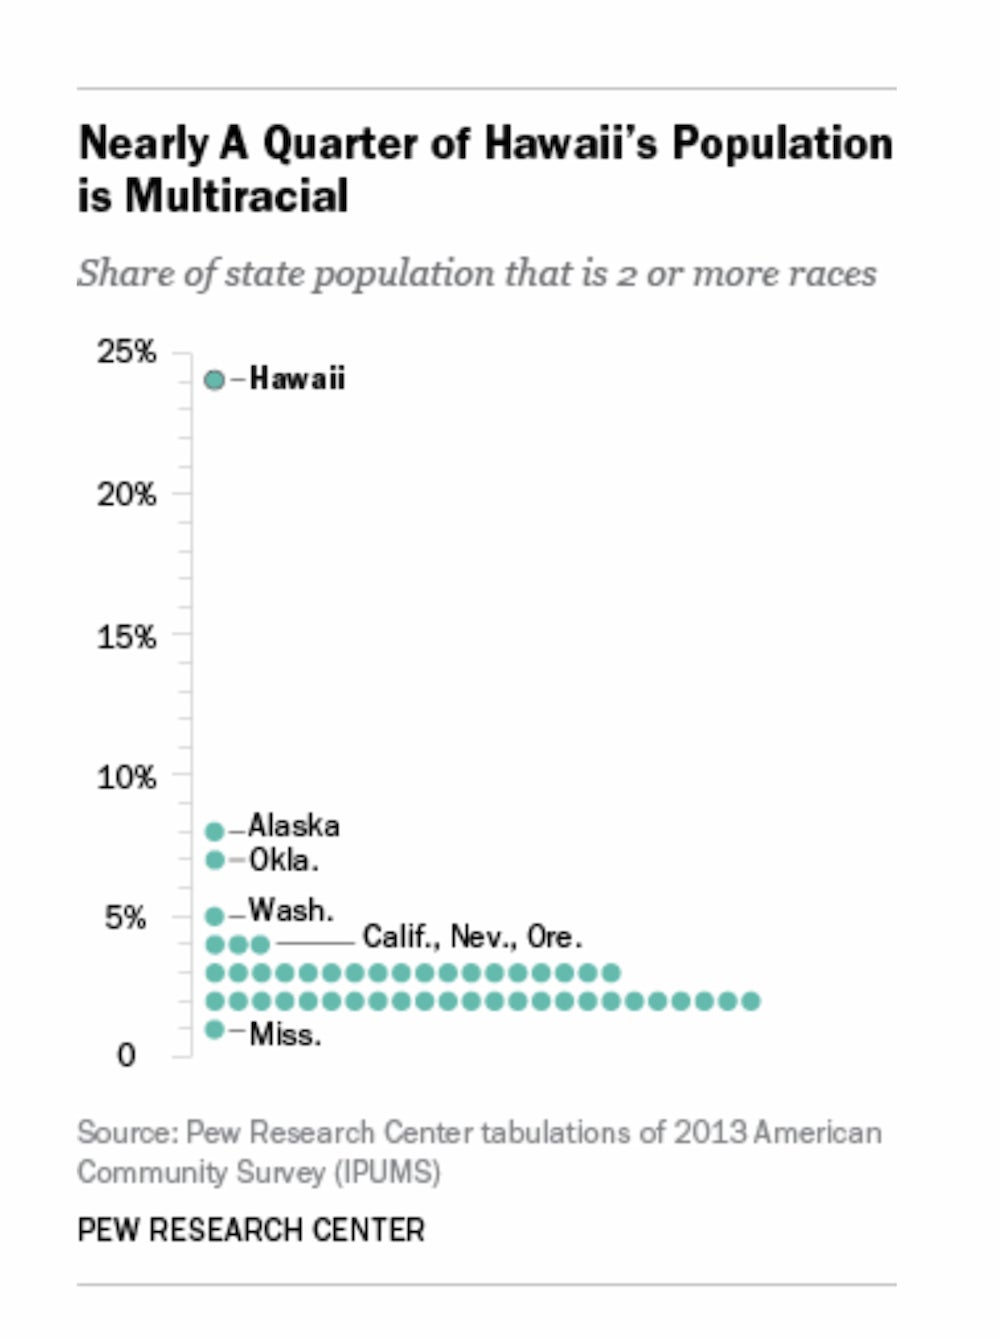
Image 34.03.06 — Data from Pew Research Center shows that Hawaiʻi is the US state with the largest share of multiracial Americans by far. (Source: Pew Research Center)
While most multiracials in Hawaiʻi today are part Asian, hapas are unique for their genealogical ties to the land. Although the majority of hapas are hapa haole, or have European and Hawaiian ancestry, there are a significant number of Black Hawaiians whose experiences in their families, schools, and on the islands are different. They, along with Black Samoans, Black Okinawans, and Black Koreans, for instance, may experience anti-Black racism.
Conclusion
The US census provides an important snapshot of the changing demographics of the American population, charting every ten years the astronomical growth of its multiracial population—from 2.7 percent in 2010 to 10 percent in 2020. This national survey also collects data on education, employment, marriage rates, and racial self-identification. From this we know that most multiracial people in the US have white ancestry and that significant portions of the Pacific Islander and Asian American communities identify as multiracial.
The 1967 Supreme Court decision in Loving v. Virginia marked shifting attitudes toward interracial unions and encouraged outmarriage. In addition, US engagement in the Pacific and Asia through war, the expansion of US laws abroad, and immigration all shape dynamics and trends within these communities. It is likely that future censuses will show even greater numbers of people who identify with more than one race. What do these changes mean for Pacific Islander and Asian American communities?
Glossary terms in this module
anti-miscegenation laws Where it’s used
Laws from as early as the 1660s that deemed marriages between white people and non-white people as illegal. More than thirty US states adopted these laws with the primary goal of preventing white women from marrying Black men, until these laws were expanded to include other populations like Chinese, Filipinos, and other nonwhite groups.
biracial baby boom Where it’s used
The large population growth of multiracial children following the 1967 Supreme Court case Loving v. Virginia, which legalized interracial marriage.
census Where it’s used
An official nationwide count that charts the US population over time through self-identification on a survey that is administered by the US government every ten years.
hapa Where it’s used
From the Hawaiian word meaning “of mixed blood,” this term now refers to a person who is part-Hawaiian and part haole (white). It can also include people with other racial backgrounds, such as Hawaiian and Korean, or Hawaiian and Black.
Loving v. Virginia Where it’s used
A US Supreme Court case in June 1967 that legalized interracial marriage on the basis that it violated the Equal Protection Clause of the Fourteenth Amendment of the Constitution.
Mexipinos Where it’s used
Refers to a person of Mexican and Filipino heritage. The term originated in San Diego, California, where Mexican women married and created families with Filipino men to form a multigenerational community of mixed Mexican Filipinos since the early 1900s.
multiracial Where it’s used
People who identify with more than one racial background, including people whose parents identify with different racial backgrounds.
outmarriage Where it’s used
A shorthand term for interracial marriage, referring to the choice to marry someone who doesn’t share the same race as one’s own.
Punjabi Mexicans Where it’s used
Refers to a person of Punjabi Indian and Mexican heritage, as well as to the larger community of primarily Punjabi men who married Mexican women in the Central and Imperial Valleys of California in the early 1900s.
race Where it’s used
A term referring to a system of power; a process by which people in power divide humans into various groups, often based on phenotype or “looks” and ancestry. Racial groups are placed on a hierarchy and are valued differently.